- VOX
- Data Protection
- NetBackup
- Interpreting metrics VMware accelerator D2D jobs
- Subscribe to RSS Feed
- Mark Topic as New
- Mark Topic as Read
- Float this Topic for Current User
- Bookmark
- Subscribe
- Mute
- Printer Friendly Page
Interpreting metrics VMware accelerator D2D jobs
- Mark as New
- Bookmark
- Subscribe
- Mute
- Subscribe to RSS Feed
- Permalink
- Report Inappropriate Content
02-10-2016 10:41 AM
All,
I would need some help interpreting the numbers below.
Each line is a job from a vmware + accelerator with manual selection policy.
The backend infrastructure has 5 esxi hosts and VMs are on 2 datastores... The media server is a VM in the same infrastructure
I am working on moving towards a query based policy while leveraging the "Intelligent" parameters for virtual infrastructure
In the first wave 25 jobs were kicked off at the same time. I do see high values for both bpbkar and bptm. bptm are usually 4-5 times higher values then the bpbkar ones.
I read the metrics below as both sides complaining... the consumer does not have full buffers to flush and in a lesser extend the consumer is complaining of not having empty buffers to right to.
While the documentation does a pretty good job at explaining what is what it is harder to identify the OMG threshold
Could that be that the infrastructure is simply being hammered with the added backup workload?
Shall I focus my efforts on cutting down on the parallelism by switching to the query based policy with parameters of the jobs or on buffer tuning?
One of the job ended up being a real full for which the overall values are better... could my current buffer settings be more suitable for this type of jobs
Any guidance would be much appreciated... I am new to backup realm
| Count | per GB | |||||||||||
| GB Written | Throughput(MB/s) | Duration | bpbkar32_waited | bpbkar32_delayed | bptm_waited | bptm_delayed | bpbkar32_waited_gB | bpbkar32_delayed_gB | bptm_waited_gB | bptm_delayed_gB | Time delayed (m) | % Time Delayed |
| 0.98 | 2.58 | 0:06:27 | 1250 | 2405 | 1091 | 8120 | 1280 | 2463 | 1117 | 8316 | 2.03 | 31.47% |
| 0.94 | 2.37 | 0:06:47 | 1291 | 2496 | 925 | 8304 | 1369 | 2647 | 981 | 8807 | 2.08 | 30.60% |
| 1.01 | 2.60 | 0:06:39 | 1400 | 2697 | 712 | 7824 | 1383 | 2664 | 703 | 7729 | 1.96 | 29.41% |
| 0.81 | 2.22 | 0:06:15 | 1562 | 2716 | 624 | 6504 | 1924 | 3345 | 769 | 8011 | 1.63 | 26.02% |
| 0.77 | 1.83 | 0:07:12 | 1437 | 3992 | 696 | 7106 | 1864 | 5179 | 903 | 9220 | 1.78 | 24.67% |
| 0.92 | 2.16 | 0:07:15 | 1801 | 2892 | 939 | 7955 | 1959 | 3146 | 1022 | 8655 | 1.99 | 27.43% |
| 1.08 | 2.70 | 0:06:48 | 1155 | 2127 | 1218 | 8786 | 1072 | 1974 | 1130 | 8154 | 2.20 | 32.30% |
| 0.84 | 2.36 | 0:06:03 | 1174 | 2288 | 582 | 6040 | 1402 | 2733 | 695 | 7215 | 1.51 | 24.96% |
| 1.04 | 2.55 | 0:06:59 | 954 | 3631 | 542 | 9158 | 915 | 3481 | 520 | 8780 | 2.29 | 32.79% |
| 0.92 | 2.13 | 0:07:21 | 1846 | 4652 | 455 | 5579 | 2014 | 5077 | 497 | 6088 | 1.39 | 18.98% |
| 1.04 | 1.60 | 0:11:03 | 2391 | 7183 | 662 | 10744 | 2307 | 6932 | 639 | 10368 | 2.69 | 24.31% |
| 1.11 | 2.04 | 0:09:17 | 1890 | 5573 | 660 | 11754 | 1703 | 5020 | 595 | 10589 | 2.94 | 31.65% |
| 1.15 | 2.21 | 0:08:54 | 2499 | 5088 | 521 | 9398 | 2168 | 4414 | 452 | 8152 | 2.35 | 26.40% |
| 1.12 | 1.89 | 0:10:10 | 3890 | 9055 | 350 | 8863 | 3464 | 8063 | 312 | 7892 | 2.22 | 21.79% |
| 1.08 | 2.16 | 0:08:34 | 2290 | 5131 | 384 | 8697 | 2115 | 4738 | 355 | 8031 | 2.17 | 25.38% |
| 1.19 | 2.40 | 0:08:29 | 2504 | 5042 | 453 | 11189 | 2102 | 4232 | 380 | 9392 | 2.80 | 32.97% |
| 0.99 | 1.54 | 0:10:57 | 2423 | 8042 | 704 | 10711 | 2450 | 8133 | 712 | 10832 | 2.68 | 24.45% |
| 1.21 | 2.41 | 0:08:33 | 2403 | 5269 | 492 | 10841 | 1991 | 4365 | 408 | 8981 | 2.71 | 31.70% |
| 0.78 | 1.29 | 0:10:22 | 3443 | 7900 | 375 | 8413 | 4403 | 10104 | 480 | 10760 | 2.10 | 20.29% |
| 1.36 | 1.91 | 0:12:10 | 2738 | 10240 | 1072 | 12198 | 2014 | 7533 | 789 | 8973 | 3.05 | 25.06% |
| 0.08 | 0.41 | 0:03:29 | 110 | 349 | 474 | 8007 | 1310 | 4156 | 5645 | 95359 | 2.00 | 57.47% |
| 1.56 | 2.09 | 0:12:45 | 4008 | 8760 | 873 | 12175 | 2573 | 5623 | 560 | 7815 | 3.04 | 23.87% |
| 1.00 | 1.76 | 0:09:44 | 1574 | 5301 | 835 | 11079 | 1571 | 5292 | 834 | 11059 | 2.77 | 28.46% |
| 0.78 | 1.18 | 0:11:12 | 2620 | 7463 | 746 | 9671 | 3374 | 9610 | 961 | 12453 | 2.42 | 21.59% |
| 0.98 | 4.38 | 0:03:50 | 428 | 771 | 539 | 5933 | 435 | 784 | 548 | 6036 | 1.48 | 38.69% |
| 1.30 | 0.85 | 0:26:13 | 204 | 258 | 76431 | 84901 | 157 | 198 | 58665 | 65166 | 21.23 | 80.96% |
| 0.86 | 0.67 | 0:21:58 | 510 | 658 | 35205 | 58199 | 591 | 763 | 40820 | 67482 | 14.55 | 66.24% |
| 1.39 | 1.21 | 0:19:30 | 674 | 1050 | 29111 | 52484 | 486 | 757 | 20983 | 37831 | 13.12 | 67.29% |
| 65.02 | 13.66 | 1:21:13 | 36736 | 40031 | 24657 | 32750 | 565 | 616 | 379 | 504 | 8.19 | 10.08% |
- Mark as New
- Bookmark
- Subscribe
- Mute
- Subscribe to RSS Feed
- Permalink
- Report Inappropriate Content
02-11-2016 12:33 AM
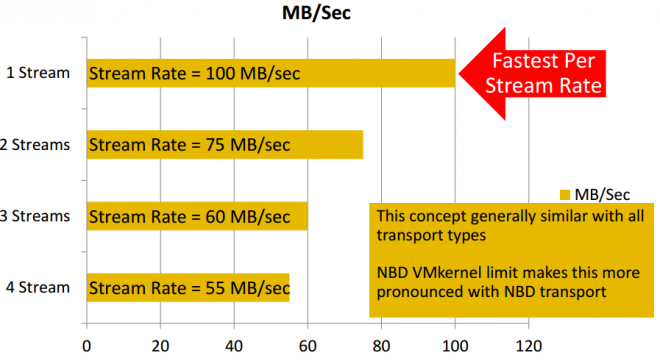
It's really difficult to judge performance metrics when each job is small. Also be aware that VMware throttle traffic using NBDB transfer metric.
Using the intelligent policy resource selection will properly help you obtain overall better performance.
See picture below of how VMware traffic shaping effect backup speed.
- Mark as New
- Bookmark
- Subscribe
- Mute
- Subscribe to RSS Feed
- Permalink
- Report Inappropriate Content
02-11-2016 12:34 AM
What are the four "_gB" columns? Is that "giga-bytes"? But they look like another set of counters?
- Mark as New
- Bookmark
- Subscribe
- Mute
- Subscribe to RSS Feed
- Permalink
- Report Inappropriate Content
02-11-2016 05:44 AM
They are the same 4 counters brought down on a per GB basis.
Thanks for taking the time
- Mark as New
- Bookmark
- Subscribe
- Mute
- Subscribe to RSS Feed
- Permalink
- Report Inappropriate Content
02-11-2016 05:54 AM
I do appreciate the feedback, thank you.
When you say
Also be aware that VMware throttle traffic using NBDB transfer metric
I read that the nfc transport is hardcoded with a limit of 100MB/s, can this be tweaked? The service console port has 10Bb/s connectivity. I understand that if doable that could shift my area of concerned towards the overhead on the esxi host but curious to see if this can be tweaked.
Based on your comments, it seems that I am really after the right thing and that there's no real downside to move towards the query base model and leveraging the advance parameters
Thanks again!
- Mark as New
- Bookmark
- Subscribe
- Mute
- Subscribe to RSS Feed
- Permalink
- Report Inappropriate Content
02-11-2016 06:03 AM
Does this helps
https://pubs.vmware.com/vsphere-50/index.jsp?topic=%2Fcom.vmware.vddk.pg.doc_50%2FvddkDataStruct.5.5.html
- Mark as New
- Bookmark
- Subscribe
- Mute
- Subscribe to RSS Feed
- Permalink
- Report Inappropriate Content
02-11-2016 06:30 AM
- Mark as New
- Bookmark
- Subscribe
- Mute
- Subscribe to RSS Feed
- Permalink
- Report Inappropriate Content
02-11-2016 06:59 AM
Yes - Please proceed to a query based model.
Its only NBDB that has the hard coded 100MB/sec limitation. Hotadd and FC transport does not.
I have been told the NBDB limitation is in place in order to secure the ESX server remain responding network wise.
- Mark as New
- Bookmark
- Subscribe
- Mute
- Subscribe to RSS Feed
- Permalink
- Report Inappropriate Content
02-11-2016 07:42 AM
If it's the same limit that I'm thinking about then I was told by an expert that the 100 MB/s throughput limit is something to do with vmKernel ports and was deliberately engineered this way by VMware with no workaround or adjustment possible.
- Mark as New
- Bookmark
- Subscribe
- Mute
- Subscribe to RSS Feed
- Permalink
- Report Inappropriate Content
02-11-2016 07:45 AM
Nicolai - why does using VIP make it any better?
- Mark as New
- Bookmark
- Subscribe
- Mute
- Subscribe to RSS Feed
- Permalink
- Report Inappropriate Content
02-11-2016 07:54 AM
Based on the link provided by nbutech it really seems to be hard coded to indeed protect the host
NBD employs the VMware network file copy (NFC) protocol. NFC Session Connection Limits shows limits on the number of network connections for various host types. VixDiskLib_Open()uses one connection for every virtual disk that it accesses on an ESX/ESXi host. VixDiskLib_Clone() also requires a connection. It is not possible to share a connection across disks. These are host limits, not per process limits, and do not apply to SAN or HotAdd.
|
9 connections directly, 27 connections through vCenter Server |
||
|
11 connections directly, 23 connections through vCenter Server |
||
|
Limited by a transfer buffer for all NFC connections, enforced by the host; the sum of all NFC connection buffers to an ESXi host cannot exceed 32MB. 52 connections through vCenter Server, including the above per-host limit. |
- Mark as New
- Bookmark
- Subscribe
- Mute
- Subscribe to RSS Feed
- Permalink
- Report Inappropriate Content
02-11-2016 08:03 AM
Based on the admin guid you can only leverage the ressource limits with the query based policy
Note: The Resource Limit screen applies only to policies that use automatic selection of virtual machines (Query Builder). If virtual machines are selected manually on the Browse for Virtual Machines screen, the Resource Limit settings have no effect
- Mark as New
- Bookmark
- Subscribe
- Mute
- Subscribe to RSS Feed
- Permalink
- Report Inappropriate Content
02-11-2016 08:29 AM
I was curious as to how/where the data was pulled from the original post.
- Mark as New
- Bookmark
- Subscribe
- Mute
- Subscribe to RSS Feed
- Permalink
- Report Inappropriate Content
02-11-2016 10:52 AM
[Deep sigh] There is probably a better way but being new to netbackup I had to resort to ops center and export the job logs (yes, one by one) and then grep the ... out of them then back into excel