OpsCenter Creating Reports
Hello,
I have a customer who is looking for some Assistance on Opscenter Reporting, I know we do not offer custom reporting through support,
I thought I would post the customers wishes to see if I have missed a Canned Report that might give what the customer whast they are looking for
The Symantec Netbackup appliance is almost full and customer needs to have some report to analyst what kind backup data used the 32 TB appliance, the detail report requirement in below
1) A report that shows the % breakdown each month of the different types of backups – Incremental, Cumulative Incremental, Full and Monthly – in terms of disk usage of the appliance over the last 12 months. Therefore for each month over the last 12 months I would like to know what percentage of the total disk space used is taken up for each type of backup.
2) A report that shows the top 25 clients per month in terms of total data backed up per client per month for the last 12 months. It would be good to know what this total is as a percentage of the total for all clients. This would be one report for each month.
3) The total number of clients per month over the last 12 months. This will let me know how many new servers have been added per month.
Thanks
Jerry
Hey Jerry,
I think I may have something here that will work and is simply a modification of an existing report...
However, this will report all backups and not specifically those that ran to a disk pool.
1) Log into OpsCenter and click on Reports / Report Templates / Job Size
2) Now click Edit Report- Set your relative timeframe to 12 months.- Set your time frame group by to 1 'months of year'- Click Next- Set your Report On: Schedule / Level Type- Set ALL 'Display Unit' drop downs to GB or TB- Click Next3) Preview and Save the Report4) Execute the report again, and click on the Historical Tab, and it will show month to month, instead of a pie chart (distribution)
Example:
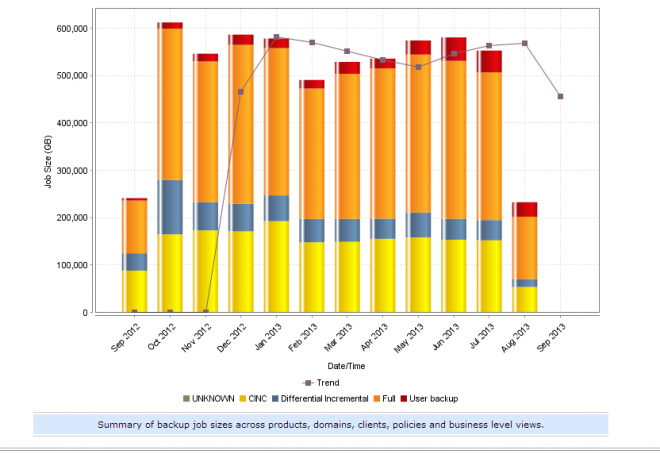
Let me know what you think...
--Tom