- VOX
- Data Protection
- OpsCenter
- Hey Jerry, I think I may have
- Subscribe to RSS Feed
- Mark Topic as New
- Mark Topic as Read
- Float this Topic for Current User
- Bookmark
- Subscribe
- Mute
- Printer Friendly Page
- Mark as New
- Bookmark
- Subscribe
- Mute
- Subscribe to RSS Feed
- Permalink
- Report Inappropriate Content
09-09-2013 10:19 AM
Hello,
I have a customer who is looking for some Assistance on Opscenter Reporting, I know we do not offer custom reporting through support,
I thought I would post the customers wishes to see if I have missed a Canned Report that might give what the customer whast they are looking for
The Symantec Netbackup appliance is almost full and customer needs to have some report to analyst what kind backup data used the 32 TB appliance, the detail report requirement in below
1) A report that shows the % breakdown each month of the different types of backups – Incremental, Cumulative Incremental, Full and Monthly – in terms of disk usage of the appliance over the last 12 months. Therefore for each month over the last 12 months I would like to know what percentage of the total disk space used is taken up for each type of backup.
2) A report that shows the top 25 clients per month in terms of total data backed up per client per month for the last 12 months. It would be good to know what this total is as a percentage of the total for all clients. This would be one report for each month.
3) The total number of clients per month over the last 12 months. This will let me know how many new servers have been added per month.
Thanks
Jerry
Solved! Go to Solution.
Accepted Solutions
- Mark as New
- Bookmark
- Subscribe
- Mute
- Subscribe to RSS Feed
- Permalink
- Report Inappropriate Content
09-19-2013 08:03 AM
Hey Jerry,
I think I may have something here that will work and is simply a modification of an existing report...
However, this will report all backups and not specifically those that ran to a disk pool.
1) Log into OpsCenter and click on Reports / Report Templates / Job Size
Example:
Let me know what you think...
--Tom
- Mark as New
- Bookmark
- Subscribe
- Mute
- Subscribe to RSS Feed
- Permalink
- Report Inappropriate Content
09-10-2013 11:47 AM
Jerry,
To Answer items 2 and 3 first,
2) A report that shows the top 25 clients per month in terms of total data backed up per client per month for the last 12 months. It would be good to know what this total is as a percentage of the total for all clients. This would be one report for each month.
Use the "Job Size" Report
Located under Reports / Report Templates / Backup / Job Activity / Job Size
Click on the Report Name - Job Size
You will then need to choose Historical and Set your Date Range using the Customize Option.
Please note: Customer must be running Analytics to report over 60 days of history.
Then click on Edit - and On the Select Parameters Page - set the Time Frame Group to 1 Month
Click Next, and on the Modify Display Options, set Ranking Chart Properties / Display : 20 (closest option to 25 that is offered)
Click Next to Preview the Report and Next Again to Save the Report.
3) The total number of clients per month over the last 12 months. This will let me know how many new servers have been added per month.
Use the "Client Count" Report
Located under Reports / Report Templates / Backup / Job Activity / Client Count
Again, you will need to Choose Historical after running the report.
You will then need to choose Historical and Set your Date Range using the Customize Option
You can again follow the steps from the item 2, to group the results by month, or add filters to only display a certain master, etc...
Make sure you save the report, for reference....
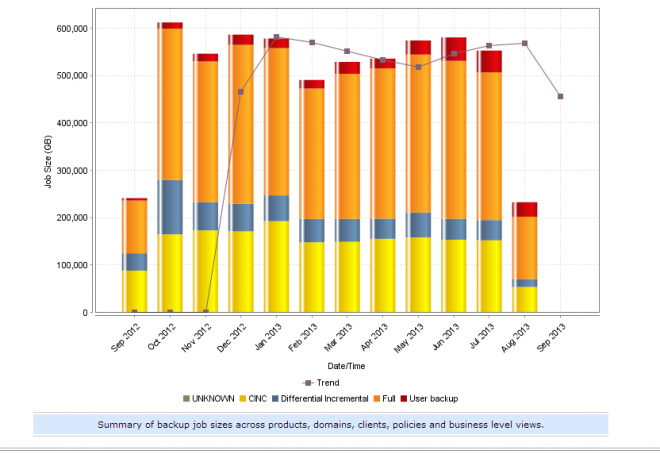
1) A report that shows the % breakdown each month of the different types of backups – Incremental, Cumulative Incremental, Full and Monthly – in terms of disk usage of the appliance over the last 12 months. Therefore for each month over the last 12 months I would like to know what percentage of the total disk space used is taken up for each type of backup.
This is a bit more involved, and not 100% sure it can be accomplished in 1 single report.
I'll try reviewing this, when I have some cycles - but you can ping me internally as well.
--Tom
- Mark as New
- Bookmark
- Subscribe
- Mute
- Subscribe to RSS Feed
- Permalink
- Report Inappropriate Content
09-13-2013 06:15 AM
Thanks for the first 2 solutions anythoughts on this one
1) A report that shows the % breakdown each month of the different types of backups – Incremental, Cumulative Incremental, Full and Monthly – in terms of disk usage of the appliance over the last 12 months. Therefore for each month over the last 12 months I would like to know what percentage of the total disk space used is taken up for each type of backup.
- Mark as New
- Bookmark
- Subscribe
- Mute
- Subscribe to RSS Feed
- Permalink
- Report Inappropriate Content
09-19-2013 08:03 AM
Hey Jerry,
I think I may have something here that will work and is simply a modification of an existing report...
However, this will report all backups and not specifically those that ran to a disk pool.
1) Log into OpsCenter and click on Reports / Report Templates / Job Size
Example:
Let me know what you think...
--Tom
- Mark as New
- Bookmark
- Subscribe
- Mute
- Subscribe to RSS Feed
- Permalink
- Report Inappropriate Content
09-23-2013 07:14 AM
Thanks Tom This will work well for the customer,